Debugging WebPack build scripts and app scripts in VSCode, Part 2
After creating a React app from scratch in part 1, we'll dive into debugging with part 2.
In a continuation of the previous topic (Here) with creating a react app from scratch, I'll go over a few ways in which you can debug your build scripts and app code in VS Code.
First, when debugging webpack builds and app js code in VS Code it's important to understand that there are two different run times involved. There is a server side runtime which runs on node.js that is used when your build scripts are running (like when webpack is bundling your app code) and there is the client side runtime that runs in the browser (where your app code executes).
For a quick recap, in the previous blog I created some build scripts you can run: "yarn build" and "yarn start" so I'll cover how to enable server side debugging with these scripts first. You can pull the code down for the previous repo Here. You should checkout the "debugging" branch which doesn't include the intentional errors of the master branch that go with the previous blog.
git clone https://github.com/rmannjbs/WP5ReactTSFromScratch.git
git checkout debugging
To follow this blog entry you should clone the previous repo, checkout the debugging branch and open it in VS Code.
Let's start with debugging server side code (such as the build and start scripts). For this we'll use VS Code's auto attach feature and then go over doing it with a launch.json config.
There's a good blog entry discussing VS Code's auto attach feature written by Kenneth Auchenberg over at https://code.visualstudio.com/blogs/2018/07/12/introducing-logpoints-and-auto-attach.
Auto Attach
Auto attach is basically the ability for Visual Studio Code to automatically attach a debugger context to processes you run from VS Code terminals. There is a special type of terminal in VS Code for debugging Javascript called the "Javascript Debug Terminal". In order for VS Code to auto attach itself to Node JS processes you'll want to be sure you are running scripts from a "Javascript Debug Terminal" in VS Code. This also has the advantage of you not having to configure launch.json configurations for Visual Studio's launcher and debug tools. Auto Attach will enable you to attach to node.js when running any yarn or npm scripts and have break points just work without ever having to configure a launch.json.
But first let me suggest making a VS Code setting adjustment so that you can see auto attach in the VS Code status bar at all times. To do that in VS Code, press (control + shift + p) and search for auto attach and click on "Debug: Toggle Auto Attach" and set it to "Always". This will cause it to show up in the status bar of VS Code which looks like this:

You can use the status bar button for "Auto Attach" to toggle it on or off. If you don't want auto attach to happen just disable it for the session. Optionally just run your scripts from a non "javascript debug terminal" and you won't get auto attach. I leave it on all the time and I run scripts from a normal terminal if I don't want to attach to them.
So now let's make sure you are in a Javascript Debug Terminal.
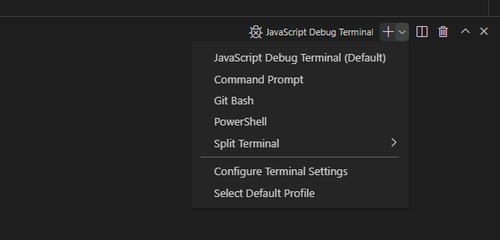
To open a Javascript Debug Terminal in VS Code, just press alt and tilde (alt + `) at the same time. You'll notice a terminal opens, this is your default terminal type and it might not be a javascript debug terminal. Now over on the right side you can click on the little drop down next to your terminal type, which looks like this:

And select "Javascript Debug Terminal". This will open a new terminal that is a Javascript Debug Terminal. (tip: You can tile terminals side by side if you want to have terminals of different types or more than one terminal open at the same time.) You can do this by selecting the "Split Pane" icon that's in the previous screen shot directly beside the drop down arrow.
So now that auto attach is on and you are in a javascript debug terminal let's see if we can debug the code from the previous blog entry.
- Assuming you pulled the code down and checked out the debugging branch go ahead and place a break point on line 35 of baseWebPackConfig.js in the build/webpack folder.
- From a javascript debug terminal with auto attach: always on, run "yarn build"
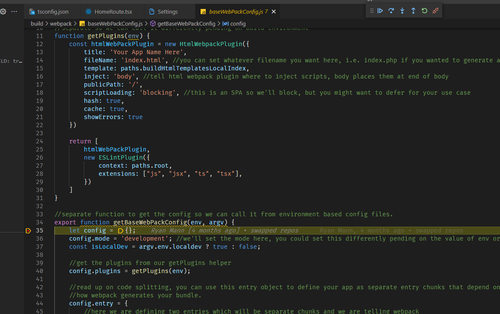
You should see that the script ran, the debugger attached, and execution has stopped on line 35 and you can debug it. You should see something like this:

And here's the cool part, there is a debug console. If you go to the debug console it works like an intermediate window, you can run code there against the current runtime execution state. So if you want to see the value of env passed into getBaseWebPackConfig you can just hover over env or in the debug console you can type "env" and it'll print out it's value, you can even modify the value of things in the debug console. Super handy for debugging server side scripts and will be invaluable in the next blog series covering Jest Tests for React Apps.
So this short walk through demonstrates how to use auto attach, which works well with any server side node js scripts/processes, including express js.
Launch.json (Server Side)
In this section we'll debug server side code but we'll do it with a launch.json file. To start with you need to create a launch.json file which you can do by going to the vscode "Run and Debug" section (ctrl + shift + d). Once there, click "create a launch.json file" under "Run and Debug".
You'll get a drop down so go ahead and click "node.js" because we want to debug our build scripts with launch.json profiles.
Let's go ahead and modify the first entry in this launch.json to debug "yarn build". Change it to the following:
{
 "version": "0.2.0",
 "configurations": [
        {
 "type": "pwa-node",
 "request": "launch",
 "name": "build",
 "runtimeExecutable": "yarn",
 "cwd": "${workspaceFolder}",
 "runtimeArgs": [
 "build"
            ],
 "skipFiles": [
 "<node_internals>/**"
            ]
        }
    ]
}
Now you have a launch.json entry called "build" that will use yarn to run the "build" script.
Go ahead and disable auto attach (just to be sure auto attach isn't doing the debugging) by clicking the auto attach toggle in the status bar at the bottom of your VS Code window. Now use the Run and Debug gui in VS Code to run the build script. Make sure "build" is selected in the drop down for "run and debug" and click the green play arrow. If you still have your break point set in the baseWebPackConfig.js, it should trip for you.
From here you can use the debug console and watch window the same way you can with auto attach. What's nice about auto attach is that you don't need a launch.json to use it. But what's nice about Launch.json is that it can be committed to source control with the rest of your project where other developers can use it which creates standardization with how developers work with the code base.
Now we'll switch to app code debugging.
Debugging app code in VS Code instead of browser dev tools.
In order to be able to debug app code in VS Code that's running in a browser we'll need to use either "Microsoft Edge" or "Chrome" which is based on the Chromium Embeded Framework. For this blog I'm going to be using Microsoft Edge.
{
 "name": "Debug in Edge",
 "request": "launch",
 "type": "pwa-msedge",
 "runtimeArgs": [
 "--remote-debugging-port=9222"
            ],
 "url": "http://localhost:9000" // Provide your project's url to finish configuring
        }
This will enable you to launch Microsoft Edge from VS Code attached to Microsoft Edge
Let's go ahead and get the app running. Reminder that you can't debug the server side build code and the client side app code at the same time, so either open a new non debugging terminal (like powershell) or turn off Auto Attach. Then run "yarn start" from the terminal. You'll notice no browser opens when we run yarn start, because I changed the dev server config in the baseWebPack config to not open one, via this section:
if (isLocalDev) {
 console.log('DEV SERVER');
 config.devtool = 'eval-source-map';
 config.devServer = {
 historyApiFallback: true,
 hot: true, //turns on hot module reloading capability so when we change src it reloads the module we changed, thus causing a react rerender!
 port: 9000,
 open: false,
 client: {
 progress: true,
 overlay: true,
 logging: 'info' //give us all info logged to client when in local dev mode
            },
 static: {
 publicPath: '/',
 directory: paths.dst
            }
        }
    } else {
 config.devtool = 'source-map';
    }
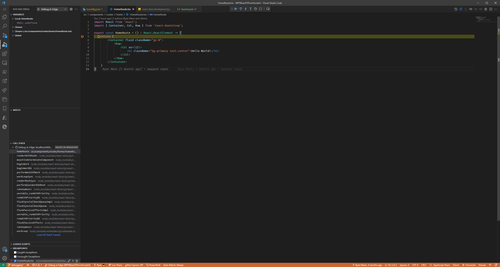
Now that the app is running, let's go ahead and run the "Debug in Edge" launch profile. You should see edge open up to localhost:9000/home. You should also notice that the debugger has attached. You can already start debugging app code in VS Code now. I.e. place a break point on line 5 of HomeRoute.tsx and refresh the page and you should see it fire.
Here's a screen shot of debugging working on HomeRoute.tsx

And that's basically the gist of it. You can now debug server side javascript and client side javascript in VS Code.
Worth mentioning, there is a new VS Code extension released by Microsoft called Microsoft Edge Tools for VS Code. However, I was unable to get the integrated dev tools and remote debugging to work at the same time. So I might follow up with an update if I figure out how to get the new extension to let you debug app js code and use the VS Code Integrated Edge Tools simultaneously.

The JBS Quick Launch Lab
Free Qualified Assessment
Quantify what it will take to implement your next big idea!
Our assessment session will deliver tangible timelines, costs, high-level requirements, and recommend architectures that will work best. Let JBS prove to you and your team why over 24 years of experience matters.


